
Data Interpretation·Lesson 12.1·7 min read
Reading a Graph
Dentists read data throughout their careers, such as X-ray reports, research on new materials and public health figures on tooth decay. Some dental schools test whether you can do the same by giving you a graph or a table and asking you to talk about it. The science is no harder than A level, and the universities already know from your grades that you can do the maths. Interviewers are therefore looking at whether you read the data carefully and explain it clearly. This lesson covers the kinds of data you might be shown, the questions you'll be asked, and a four-step method for answering them.
What you might be shown
Data stations use several kinds of chart, and the data can come from any area of healthcare, so it won't always be about teeth. The three charts below are typical, and you may also be given a table.
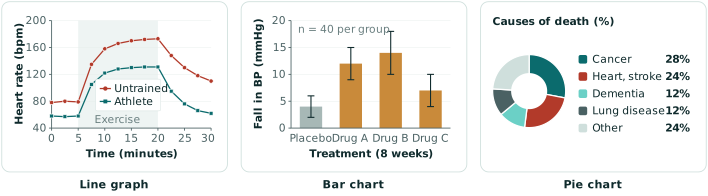
- A line graph shows how a measurement changes, usually over time. It's the most common format, and it often shows how the body responds to something, such as exercise, a meal or a drug.
- A bar chart compares groups, such as the patients who were given different drugs in a trial. The thin lines on top of the bars are error bars, which show how much uncertainty there is in each result.
- A pie chart shows how a total is divided up, such as the causes of death in a country. It's most often used for public health figures.
- A table gives the figures themselves, such as the results for each group in a study. Read the column headings first, because that is usually where the units are.
Whichever one you're shown, the questions follow a similar order. They start by asking you to describe the data, then ask you to explain it, and often finish with a wider question. For the three charts above, you might be asked:
- "Describe the heart rate changes. Why does the athlete recover faster?"
- "Which drug lowers blood pressure most? Can you be sure, given the error bars?"
- "Describe this chart. How would it have looked 100 years ago, and why?"
Data questions have been reported at Birmingham in recent years and at Leeds in the past.
How to answer a data question
We recommend answering in four steps:
- 1.Orient. Say what the graph shows before you describe any pattern in it.
- 2.Describe and compare. Give the overall pattern, then the key values, then the differences between groups.
- 3.Explain. Suggest a reason for the pattern.
- 4.Extend. Add a limitation of the data, or something else you would want to know.
An example, step by step
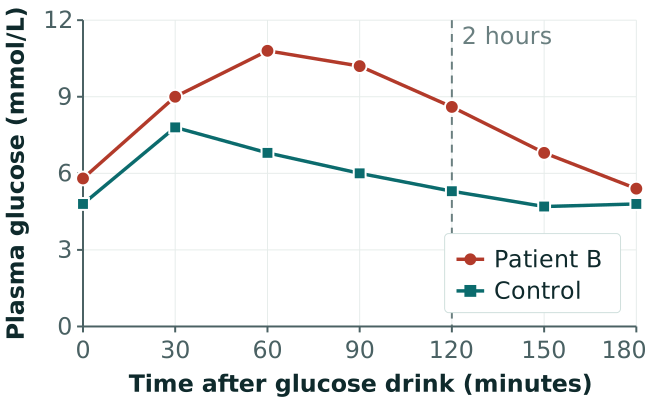
The rest of this lesson goes through each step in more detail, using the graph below. It shows a glucose tolerance test, in which a patient has a sugary drink and their blood glucose is measured over the next three hours.
Step 1: Orient
To orient yourself, look at the title, what is on each axis and in what units, and how many groups there are. Check whether one of the groups is a control, and whether each line is a single patient or an average of many. Also check whether the vertical axis starts at zero, because if it doesn't, small differences look large.
You only need a sentence or two for this step, and saying it also gives you time to read the graph properly. For this graph, you could say:
"This graph shows plasma glucose, in millimoles per litre, over three hours after a glucose drink. There are two lines, one for patient B and one for a healthy control."
Step 2: Describe and compare
Give the overall pattern in one sentence, and then the detail. Where there is more than one group, compare them directly: the starting values with each other, the peaks with each other, and how long each takes to return to where it started. Say how big each difference is.
Every sentence should include a number and a unit. You can't read exact values from a graph, so read to the nearest gridline and say "about". A description such as "patient B's glucose goes up more and stays high" is true, but it's too vague for the interviewer to give you credit for it. A good test is whether someone who couldn't see the graph could sketch it from your description. For this graph, you could say:
"In both people, glucose rises after the drink, reaches a peak and then falls back towards its starting level. Patient B starts slightly higher, at about 6 millimoles per litre compared with about 5, and peaks at about 11, which is about 3 higher than the control. Patient B also peaks later, at 60 minutes compared with 30. At two hours, the control is almost back to its starting level, but patient B is still at about 8.5 and takes another hour to return to where they started."
Leave the explanation for the next step. If the question only asks you to describe the graph, stop here, because interviewers usually ask for the explanation separately.
Step 3: Explain
The reason you suggest doesn't have to be the right one, but it has to be sensible, and it should say what is happening in the body. "Patient B has prediabetes" is only a label, whereas "patient B's insulin isn't working as well, so glucose stays in the blood for longer" is an explanation.
Be as confident as the data allows. One test on one patient can't prove a diagnosis, so say "this is consistent with" and not "this proves". Where you can, offer a second possibility and say which you think is more likely.
This step is easier if you know the science behind common graphs. For a glucose tolerance test, the key fact is that insulin moves glucose from the blood into cells. In diabetes, either very little insulin is produced or the body responds to it poorly, so glucose rises higher and takes longer to fall. Diabetes is diagnosed when the two-hour value is 11.1 or higher, and a value between 7.8 and 11 is called impaired glucose tolerance. For this graph, you could say:
"This is consistent with patient B's insulin not working as well as it should, so glucose moves into cells more slowly and stays high for longer. The most likely explanation is impaired glucose tolerance, sometimes called prediabetes. The glucose isn't high enough for diabetes, but it shows a higher risk of developing type 2 diabetes. It could also be a one-off, for example if the patient hadn't fasted properly before the test."
Step 4: Extend
One or two wider points are enough here, such as a limitation of the data or something else you would want to know. Keep them short, because interviewers usually have follow-up questions of their own. For this graph, you could say:
"This is one test on one patient, so I'd want it repeated before drawing a conclusion. I'd also want to know the patient's age, weight and family history."
Two follow-up questions are especially common. For "What are the risk factors for this condition?", split your answer into those a patient can't change, such as age and family history, and those they can, such as diet, exercise and weight. For "What would you consider before giving this drug?", think about the patient first, including their age, weight, kidney function and allergies, and then about the drug, including its side effects and how it interacts with other medicines.
A dental example to try
The same four steps work for dental data. Imagine a bar chart from the 2024 survey of five-year-olds in England, which shows the percentage of children with tooth decay. One bar is for all children, at 22.4%, one is for the most deprived areas, at 32.2%, and one is for the least deprived areas, at 13.6%. Try describing it out loud before you read the answer below.
Orient. "This bar chart shows the percentage of five-year-olds in England who had tooth decay in a 2024 survey, for all children and for the most and least deprived areas."
Describe and compare. "Overall, about 22% of children had decay, which is more than one in five. In the most deprived areas it was about 32%, compared with about 14% in the least deprived, so children in the most deprived areas were more than twice as likely to have decay."
Explain. "One possible reason is diet, if children in poorer areas have more sugary food and drink. It could also be that their families find it harder to get to a dentist, or that fewer of them brush twice a day with fluoride toothpaste. I think it's likely to be a mixture of these."
Extend. "The chart shows a link with deprivation, but it can't show which cause is responsible. I'd want to know how the figures have changed over time, and whether areas with fluoride in the water do better."
Other things to remember
- Read the whole question first. Data questions often have several parts, and it's easy to answer only the first.
- Say your reasoning out loud. The interviewer can only give you credit for what they hear.
- Correct your mistakes out loud. If you misread a value, say so and give the right one. Noticing and fixing an error is what a safe dentist does, and it won't count against you.
What's next
The next lesson covers calculations, such as working out a dose of local anaesthetic.
Put Your Knowledge to the Test
Tackle data questions from real dental school interviews with our realistic AI interviewer, then receive personalised feedback and model answers.