
Worked Examples·Lesson 3.2·11 min read
Worked Example: A Data Interview
In this lesson we'll work through one complete data interview, built around a single graph that grows as the interview goes on. Graphs and tables come up in most Oxbridge interviews, and they often lead into questions about trials and patients, as this one does. Over seven questions it moves from describing a survival curve to designing a trial and advising a patient. Each question follows the method in Lesson 4: describe before you interpret.
The worked sequence
The tutor shows you a graph of the percentage of patients still alive at each point after diagnosis. All the patients have the same disease. More curves are added as the interview goes on, and the exact figures are in a table at the end of the sequence, so you can check your readings.
Try each question out loud before reading on.
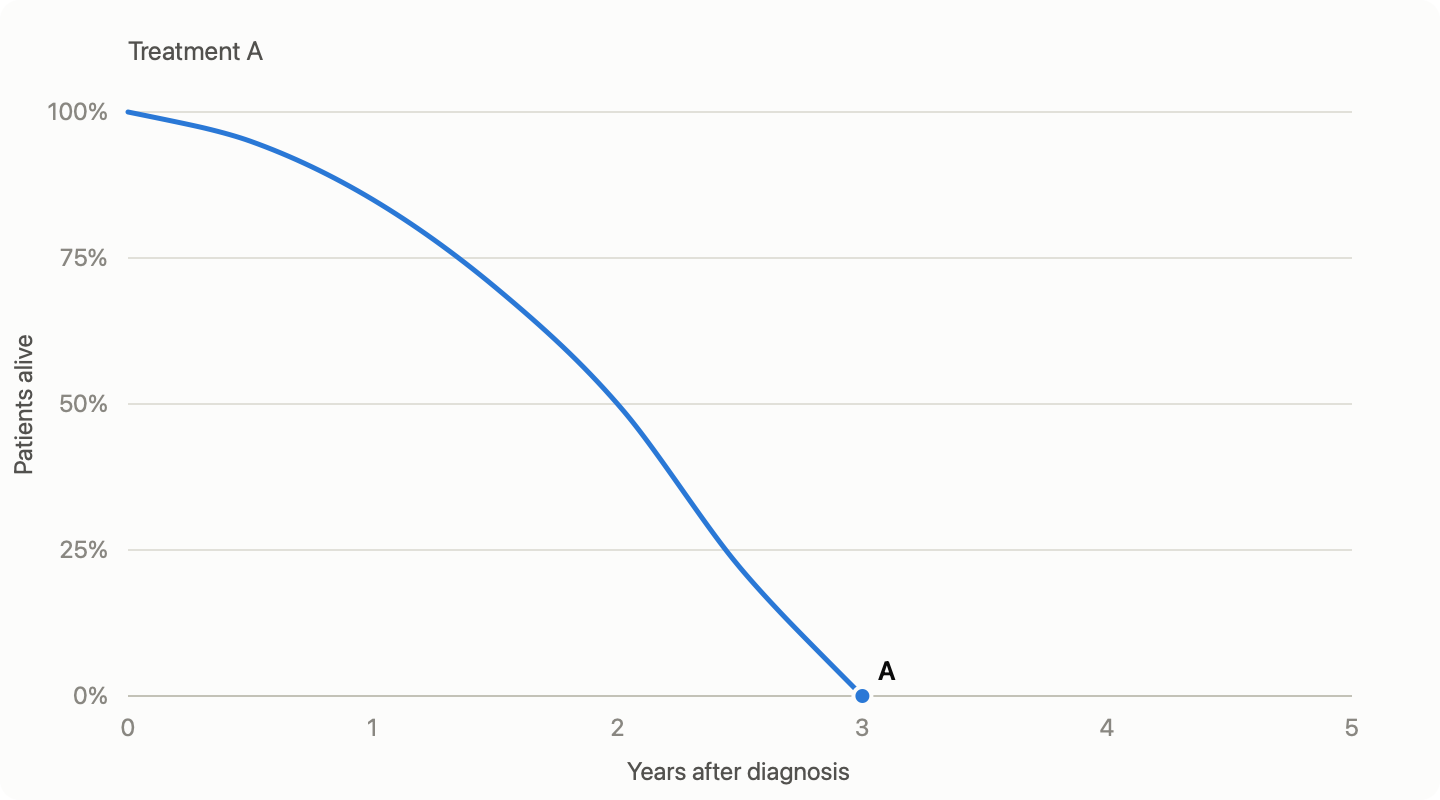
Question 1: "Here is the curve for Treatment A. Describe what you see."
How to approach it: Start with what the axes show. Then give the shape with numbers: where it starts, where it ends, and where half the patients are still alive.
Where candidates go wrong: Saying "it goes down", or jumping straight to "this looks like cancer". If the tutor asks "what is on each axis?", you have skipped the description. Naming the disease is a guess the graph can't support.
A strong answer:
The graph shows the percentage of patients still alive against time since diagnosis. Everyone is alive at diagnosis. About half are alive at two years, and by three years nobody is. So this is a very serious illness, and on this treatment nobody survives beyond about three years.
Why it works: It reads the graph before interpreting it, uses three numbers, and draws only the conclusion the data supports.
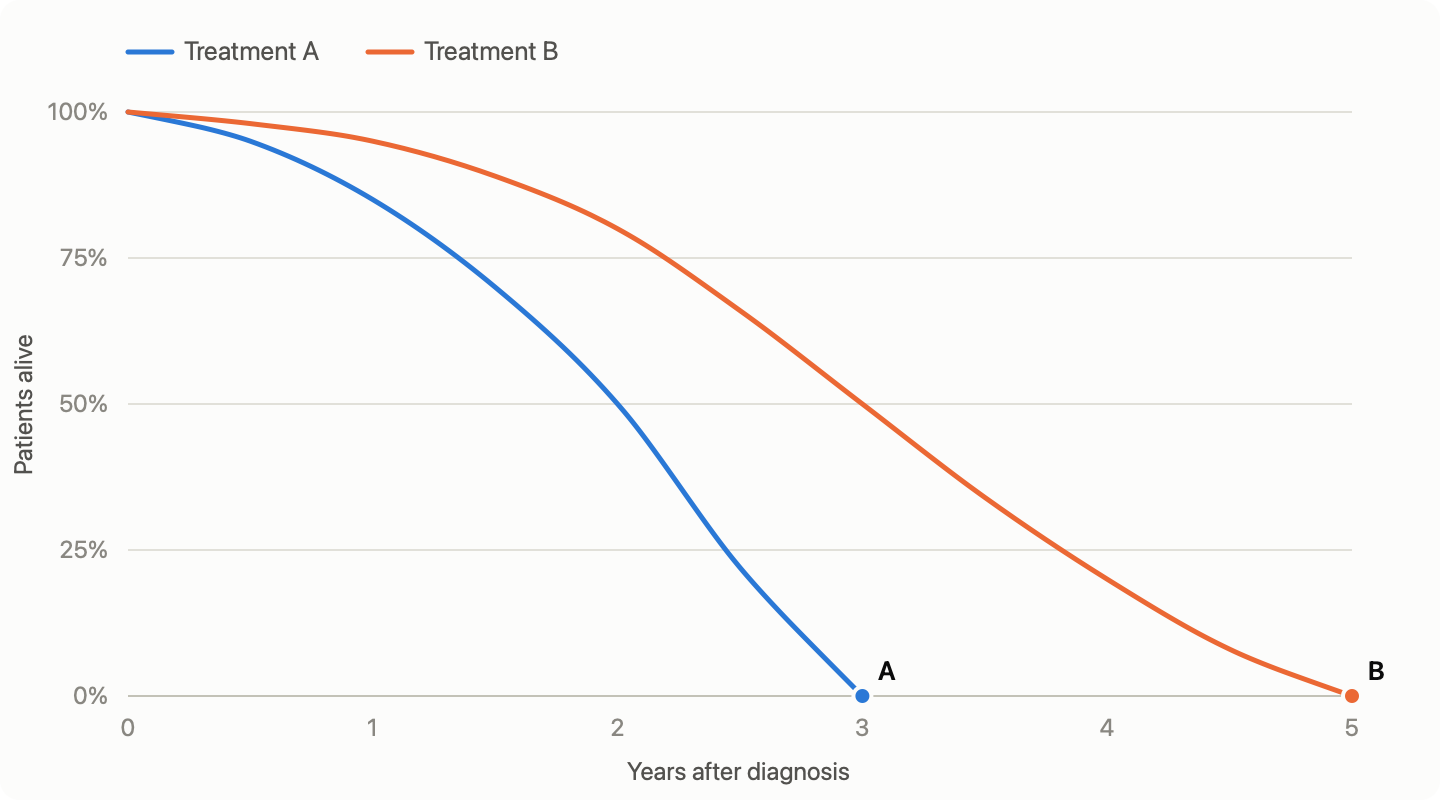
Question 2: "Now Treatment B is added. Compare the two. If you had to give one number to sum up the difference, what would you use?"
How to approach it: There are several numbers you could pick. Choose one, and say why it is a fair summary.
Where candidates go wrong: Saying "B is better" with no measure, or choosing the time at which the last patient dies. That depends on a handful of patients at the very end. If the tutor asks "is that a fair picture of what happens to most patients?", they are steering you away from the extreme.
A strong answer:
B is better throughout: the curve is always above A. To sum it up I'd use the median survival, the time at which half the patients are still alive, because that describes the typical patient and isn't decided by the last few. That is about two years for A and three years for B, so B gives roughly an extra year.
Why it works: It picks a measure, justifies it, and applies it to both.
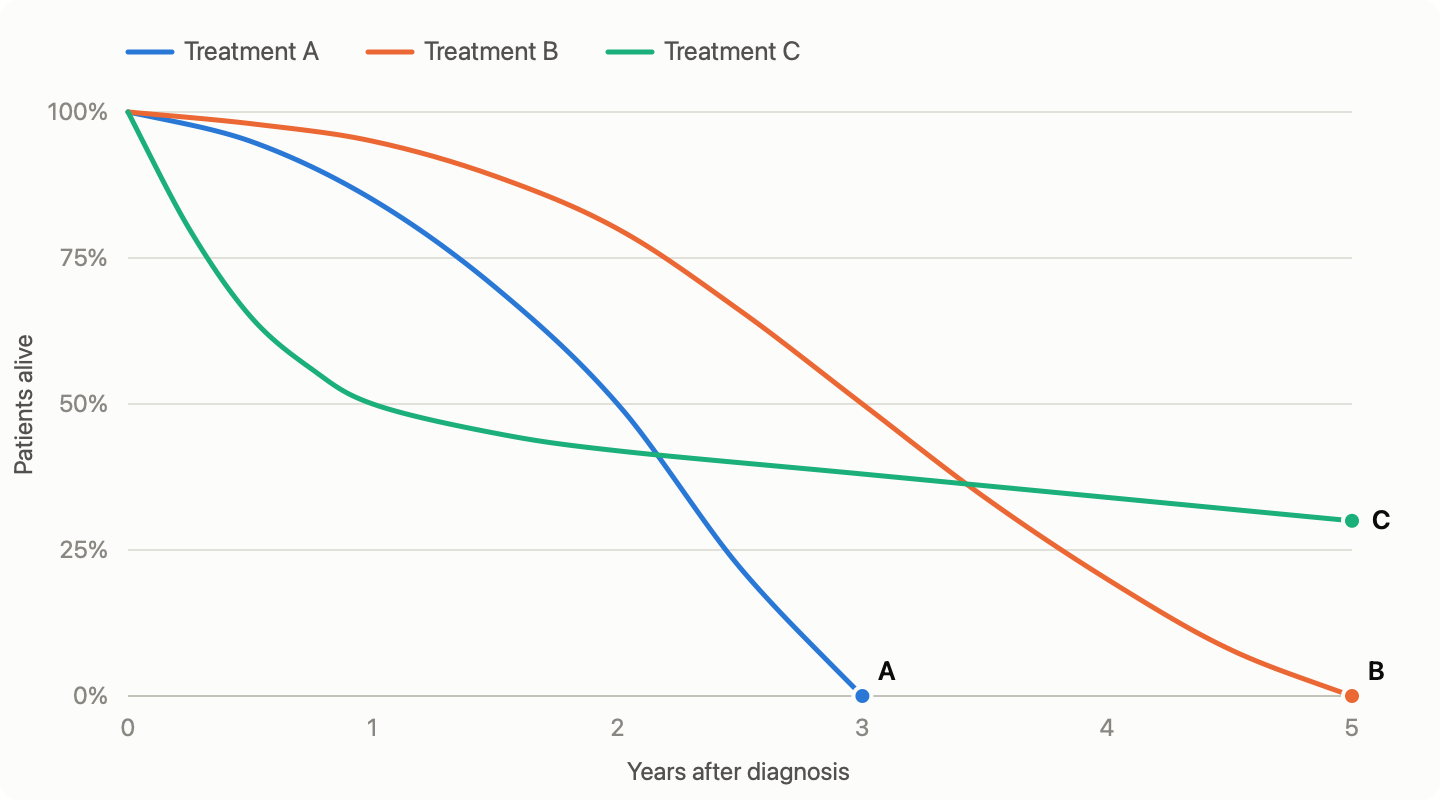
Question 3: "Here is Treatment C. On your measure it is the worst of the three. So should we stop using it?"
How to approach it: The tutor is using your own measure against you. Check whether it still tells the whole story by looking at the whole curve, not one point on it.
Where candidates go wrong: Agreeing, because they have committed to their measure and feel they should defend it. The tutor's provocation is the hint: a statement that sounds too strong is an invitation to disagree. Others go too far the other way and say C cures people.
A strong answer:
On that measure, yes: half the patients on C have died within a year. But the measure only describes the first half of the curve. After the first year C levels off, and at five years about 30% of patients are still alive, when nobody on B is. So C is worse in the short term and much better in the long term, and one number hides that. The levelling off might mean some patients are cured, but the curve is still falling slowly, so I can't be sure. I'd also wonder whether the early deaths are caused by the treatment itself being harsh.
Why it works: It concedes what is true, shows exactly where the measure fails, and is careful about what the plateau does and does not show. Changing your view of your own measure is what the question was asking for.
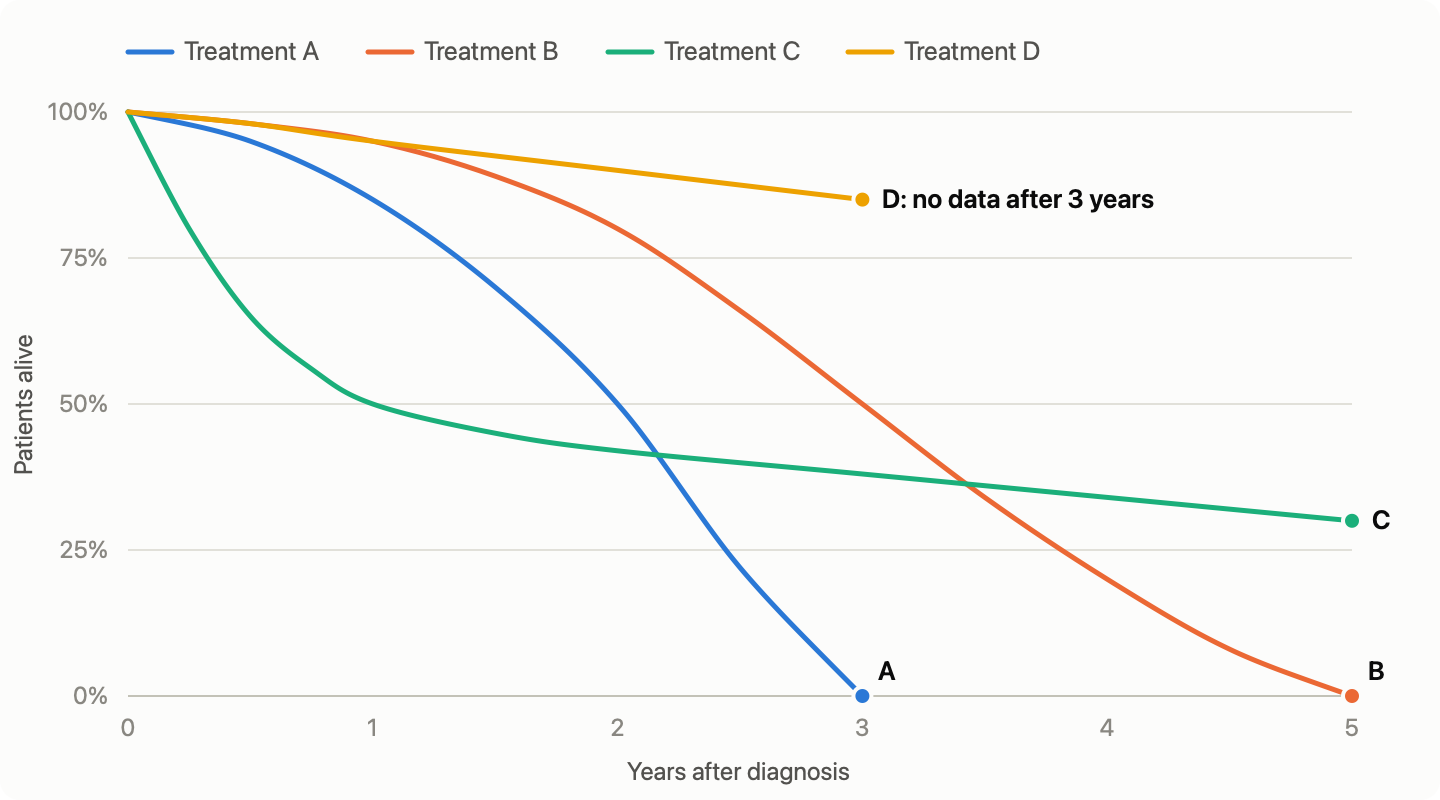
Question 4: "Treatment D is new. We only have three years of results. What do you make of it?"
How to approach it: Say what the data shows, then say clearly what it can't show.
Where candidates go wrong: Calling D the best treatment. It has the highest curve, but only as far as it goes. Assuming the four curves come from comparable patients is the other trap.
A strong answer:
So far it looks very good: 85% alive at three years, compared with 50% on B. But there are two things I'd want to know. First, what happens after three years. It could keep going, or it could fall away as A and B did, so I'd want five years of data before saying it is better than C. Second, who the patients were. A new treatment is often first tried in a small group of carefully chosen patients, who may be fitter or diagnosed earlier than the patients on the other curves. If so, some of D's advantage could come from the patients rather than the treatment, and the only way to be sure is a fair comparison.
Why it works: It separates what is known from what is not, asks whether the comparison is fair, and says what evidence would settle it. The second point leads straight to the next question.
Question 5: "How would you find out whether Treatment D is really better than Treatment C?"
How to approach it: Say what you would compare, in whom, and what you would measure. Then deal with what makes the comparison fair, how long it needs to run, and whether it is ethical.
Where candidates go wrong: "Give D to some patients and see how they do." With no comparison group, or with doctors choosing who gets D, a good result could come from the patients rather than the treatment, which is the problem raised in Question 4. Other common gaps are forgetting how long the trial has to run, and ignoring the obvious ethical question: if D looks so much better, is it fair to give anyone C? If the tutor asks "who decides which patients get D?", they are pointing you towards randomisation.
A strong answer:
I'd run a trial comparing D with C directly. I'd take patients with the same disease at the same stage and allocate them to C or D at random, rather than letting doctors choose, because they might give the new treatment to the fitter patients. Then the groups differ only by chance. I'd follow both groups for at least five years, because what happens on D after three years is exactly what we don't know, and I'd need enough patients that one or two deaths can't change the picture. I'd decide in advance what counts as better: survival, but also quality of life during treatment, because the two might disagree. Patients and doctors will probably know which treatment they are on, but that can't bias whether someone survives, so blinding matters less here than it would for something like pain. The hardest part is the ethics. D's early results look much better, so some would say it is wrong to give anyone C. But those results cover only three years and possibly a selected group, so I think there is still genuine uncertainty, and that is what makes the trial ethical. I'd also want an independent committee watching the results, so the trial could stop early if one treatment turned out to be clearly better.
Why it works: It covers a fair comparison, the right measurement for long enough, enough patients, and a clear idea of what result would answer the question. It then deals with blinding and with the ethical tension that the early data creates, rather than ignoring it. The same points apply to almost any "how would you test it?" question. Lesson 3 covers the ideas behind them: randomisation, blinding, confounding, the ethics of research and choosing the right study design.
Question 6: "A 35-year-old patient with this disease has two young children. They ask you which treatment they should have. What do you say? They don't want percentages."
How to approach it: There is no single right treatment here. Explain the trade-off in plain words, find out what matters most to the patient, and be honest about what isn't known.
Where candidates go wrong: Repeating the statistics in the same language as before. Picking a treatment without asking what the patient wants. Or refusing to give any view, which leaves the patient with nothing. If the tutor, speaking as the patient, says "but I need to be well enough to look after my children now", they are telling you what this patient values.
A strong answer:
I wouldn't suggest A, because B does better than it at every point, so I'd explain that there are two established options worth considering. With one, most people live another two or three years, but nobody in the study lived beyond five. The other carries a much bigger risk at the start, and about half of people don't survive the first year, but those who get through it have a real chance of living much longer. There is also a newer treatment that looks promising so far, but we only know how people do for the first three years. I'd be honest that these figures only tell us how long people live, not how they feel during treatment, and that I'd want to find that out for them. Then I'd ask what matters most to them. If being there for their children over the next few years comes first, that points one way. If they would accept a serious early risk for the chance of seeing their children grow up, it points the other.
Why it works: No jargon, it drops the option that is never the best choice, the trade-off is clear, the uncertainty about D and the limits of the data are stated honestly, and the decision is built around what the patient cares about.
Question 7: "Now the patient is 88 and lives alone. Does your advice change?"
How to approach it: The person has changed. Ask whether the data still applies to them, and whether what matters to them is different.
Where candidates go wrong: Giving the same answer as before, assuming that an older patient should simply be given less treatment, or applying the curves to this patient without asking whether they fit.
A strong answer:
It might, for two reasons. First, the evidence may not apply to them. Trials often include few patients this old, so I'd want to know whether these curves come from people like this patient. Older patients are often less able to cope with an intensive treatment, so the early risk on C could be higher than the graph shows. Second, what matters to them may be different. A long-term chance may matter less than the next few years, and a treatment with a high risk of dying in the first year is harder to justify. So I'd lean towards the steadier option. But I'd still ask what they want, because some 88-year-olds would choose the chance of more time, and as they live alone I'd want to know what support they would have during treatment.
Why it works: It checks whether the evidence applies before using it, then uses the same reasoning as in Question 6 for a different person. The conclusion changes because the facts have changed, not because the reasoning has. That consistency is what the tutor is checking.
The values behind the graph
These are the figures you would read off the final graph.
| Time after diagnosis | Treatment A | Treatment B | Treatment C | Treatment D |
|---|---|---|---|---|
| At diagnosis | 100% | 100% | 100% | 100% |
| 1 year | 85% | 95% | 50% | 95% |
| 2 years | 50% | 80% | 42% | 90% |
| 3 years | 0% | 50% | 38% | 85% |
| 4 years | 20% | 34% | No data yet | |
| 5 years | 0% | 30% | No data yet |
What to take from this
- Describe before you interpret. The first answer was an accurate description with numbers, and every later question relied on it.
- A single number can mislead. Median survival summed up A and B well and gave the wrong picture of C. When a summary produces a surprising result, look at the whole curve and ask what the number leaves out.
- Use everything you are given. A new curve, a curve that crosses another, a line that stops early. Each one was added for a reason.
- Say what the data doesn't show. The most important things about D were the years with no data and the question of who its patients were. Naming a limit is a strong answer, not a weak one.
- Data leads to decisions. The interview moved from reading a graph to designing a trial to advising two different patients. The last two questions had no single right answer. They tested whether the candidate could explain clearly, be honest about uncertainty, and fit the decision to the person.
Try a question with model answers
Try a question from MedPrepPartner's Oxbridge interview question bank, including questions on graphs and data. Every question comes with a model answer and an explanation of what it is testing, so you can answer it out loud first, describing the data before you interpret it, and then compare.
MedPrepPartner's Oxbridge AI interviewer includes data questions with graphs and tables, and follows up on your answers as a tutor would.